EVI INDUSTRIES (EVI)·Q2 2026 Earnings Summary
EVI Industries Delivers Record Q2 as Revenue Surges 24%, Stock Up 1.5%
February 9, 2026 · by Fintool AI Agent
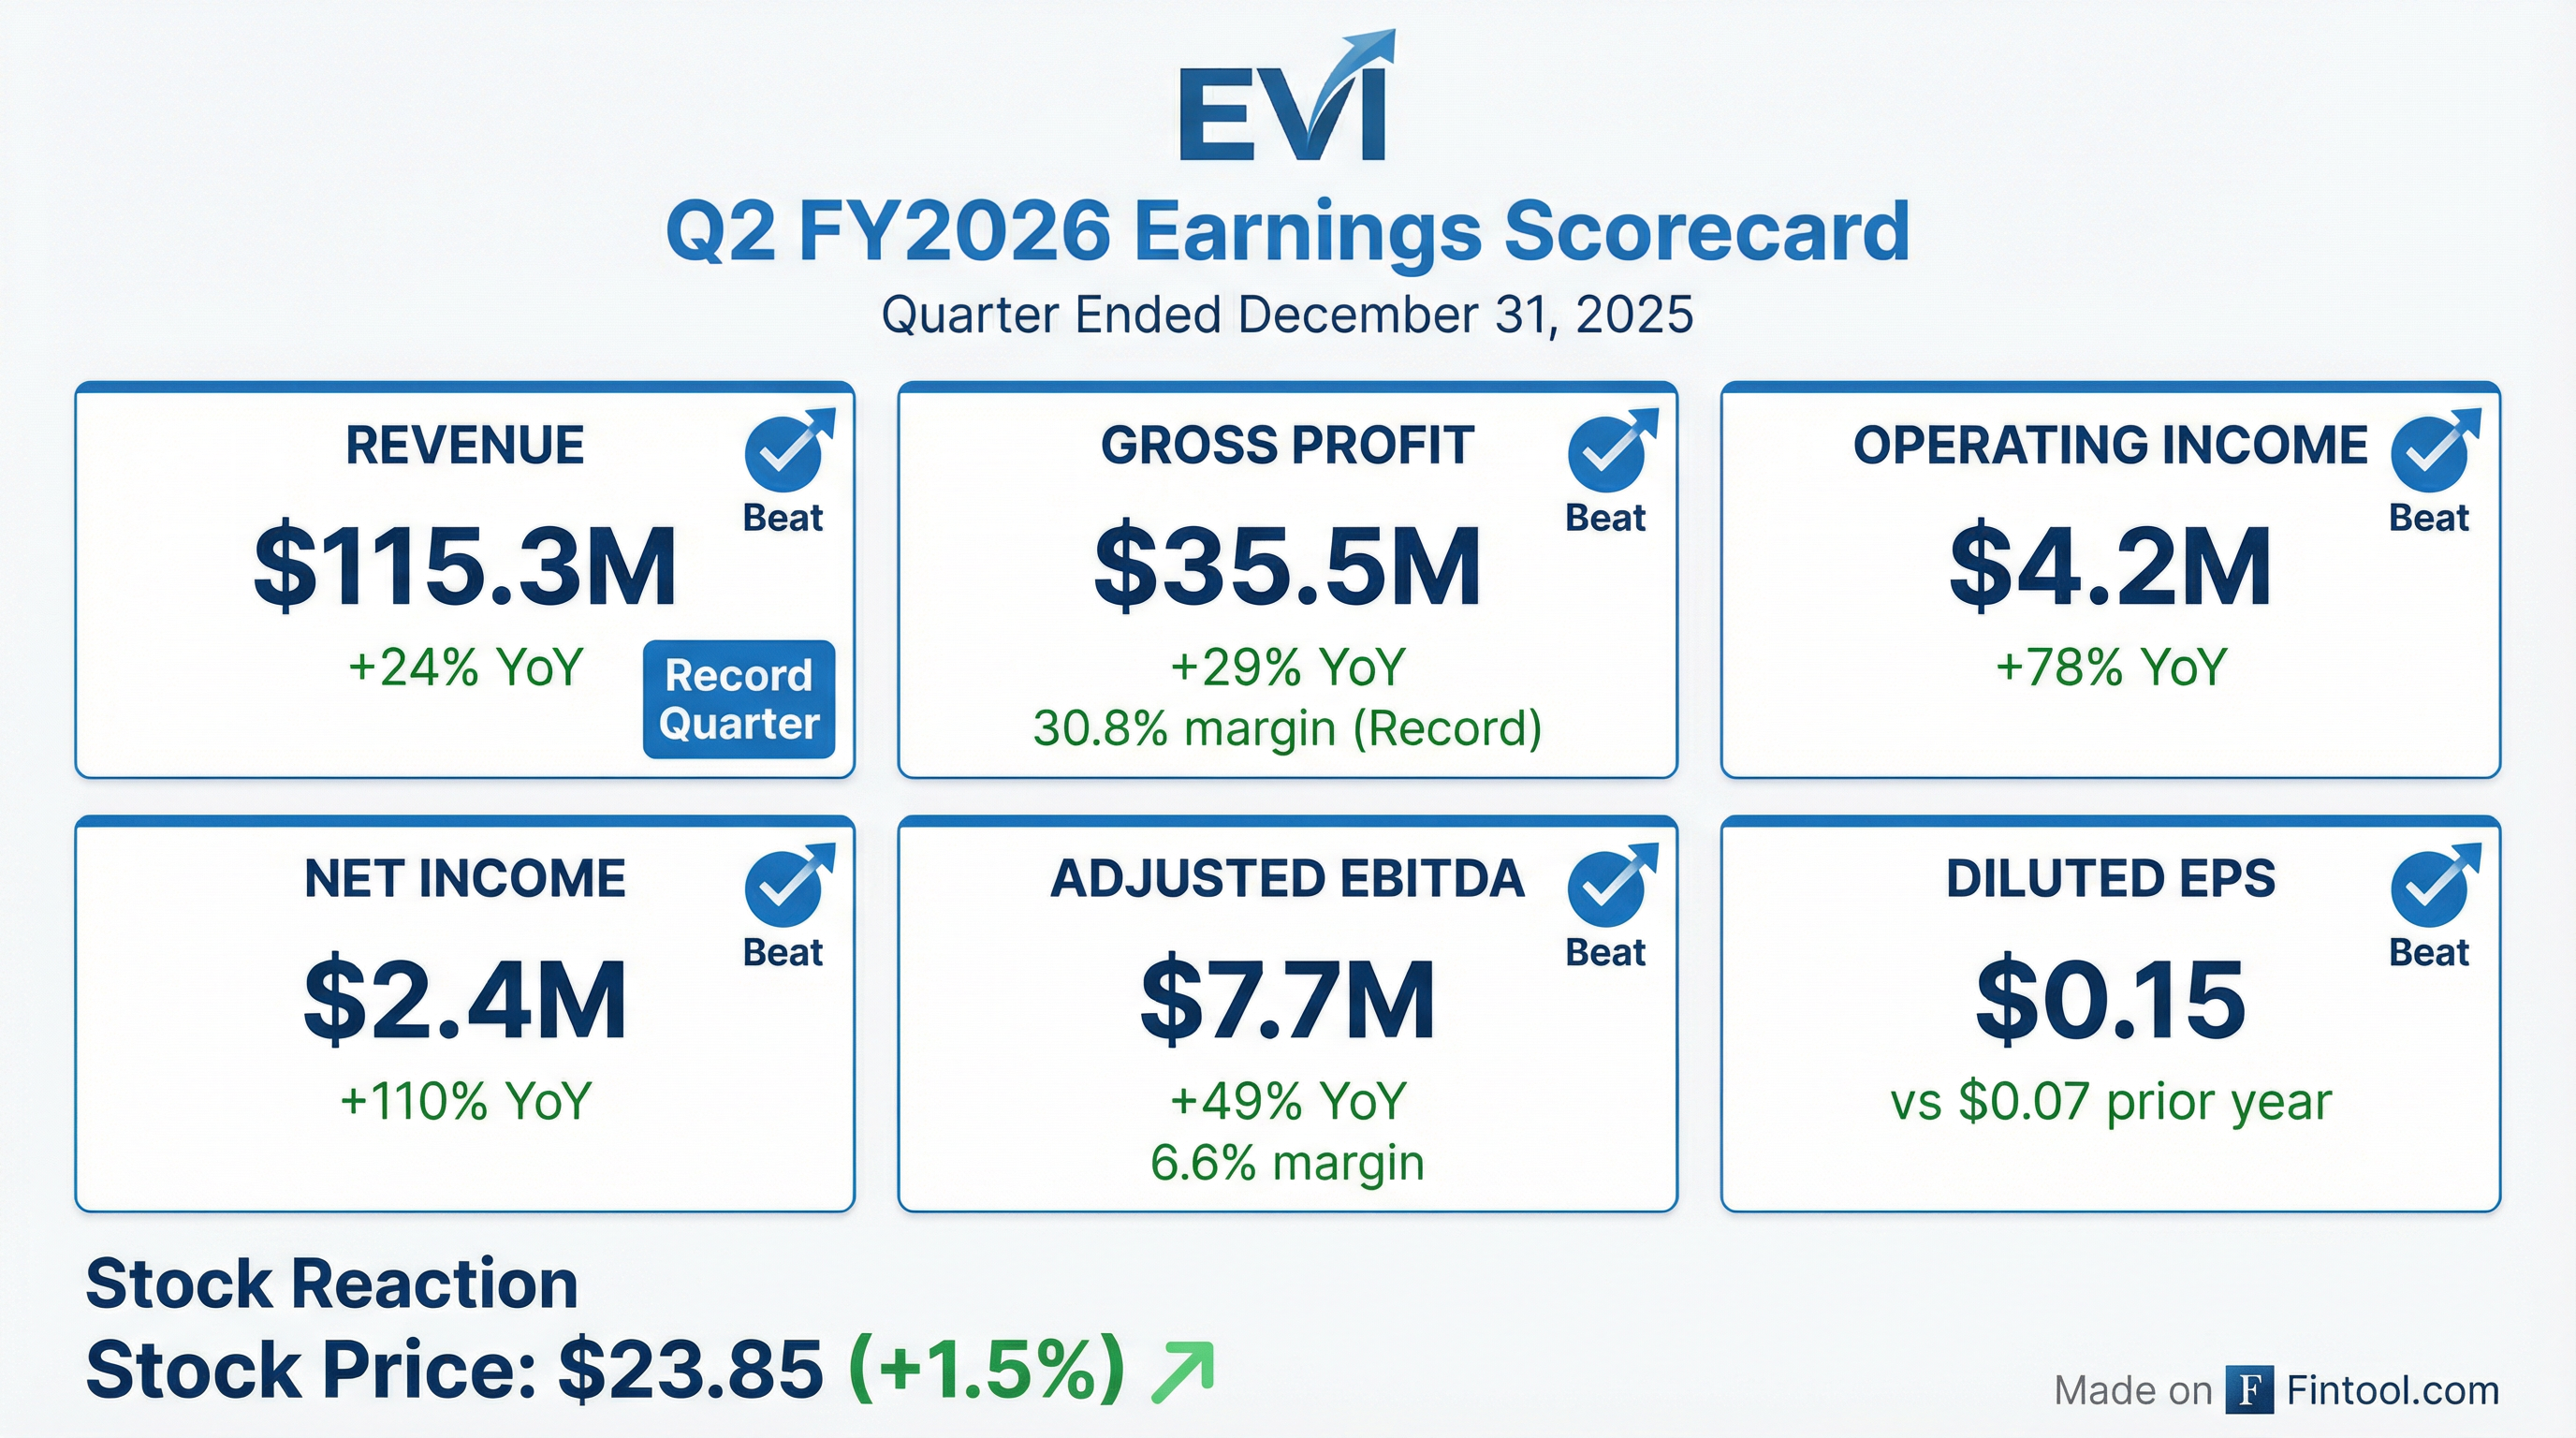
EVI Industries (NYSE American: EVI) reported record Q2 FY2026 results, with revenue surging 24% year-over-year to $115.3 million, gross profit jumping 29%, and net income more than doubling . The commercial laundry distribution leader delivered across all key metrics as the Continental acquisition and organic momentum fueled the company's strongest quarter ever. Shares rose 1.5% to $23.85 following the release.
Did EVI Beat Expectations?
EVI delivered record results across the board, though analyst coverage is limited for this $306 million market cap company:
The company also surpassed $425 million in trailing twelve-month revenues, marking a significant milestone in its growth trajectory .
What Changed From Last Quarter?
Q2 FY2026 showed meaningful improvement from Q1 FY2026:
Key drivers of sequential improvement:
- Revenue accelerated from contributions of acquired businesses and legacy operations
- Net income margin improved despite lower gross margin as SG&A leverage improved
- Operating efficiency gains from technology investments beginning to materialize
How Did the Stock React?
EVI shares rose modestly following the earnings release:
The stock has recovered from its 52-week low but remains 31% below its 52-week high, suggesting the market may still be digesting the company's heavy investment cycle.
What Did Management Say?
CEO Henry Nahmad emphasized the company's long-term positioning:
"EVI has built a differentiated enterprise with deep customer relationships, expansive sales and service reach, and a strategy to become the undisputed leader in our industry. The investments we are making today in people, technology, and operational capabilities are grounded in the strength of our underlying business."
On capital allocation:
"Our strategy remains grounded in disciplined execution and thoughtful capital deployment. As we continue to build on our reputation as a trusted acquirer and partner in the commercial laundry industry, we are also taking a more expansive view of growth—evaluating opportunities that leverage our relationships, operating capabilities, and distribution reach."
Technology & Modernization Initiatives
EVI continued advancing operational technology during the quarter :
Field Service Platform:
- ~9,000 service appointments supported in Q2
- 13% improvement in average response time over the past 12 months
- Platform now enables real-time remote technical support
Operational Analytics:
- Expanded technician utilization dashboards for productivity visibility
- Standardized maintenance workflows reducing unnecessary site visits
- "Meaningful improvement in service margins" from technology-enabled optimization
Inventory & Procurement:
- Analytics-driven tools deployed across 15,000+ SKUs
- Integrated demand planning and visibility across order continuum
- Aimed at improving working capital management
Capital Position & Cash Flow
The balance sheet remains strong despite strategic investments :
Cash flow notes:
- Operating cash flow positive for both Q2 and H1 FY2026
- Inventory increased ~$12M to support confirmed customer orders in backlog
- Paid ~$5M cash dividend during the period
- Final payment made on Continental acquisition
The 10-Year Transformation Story
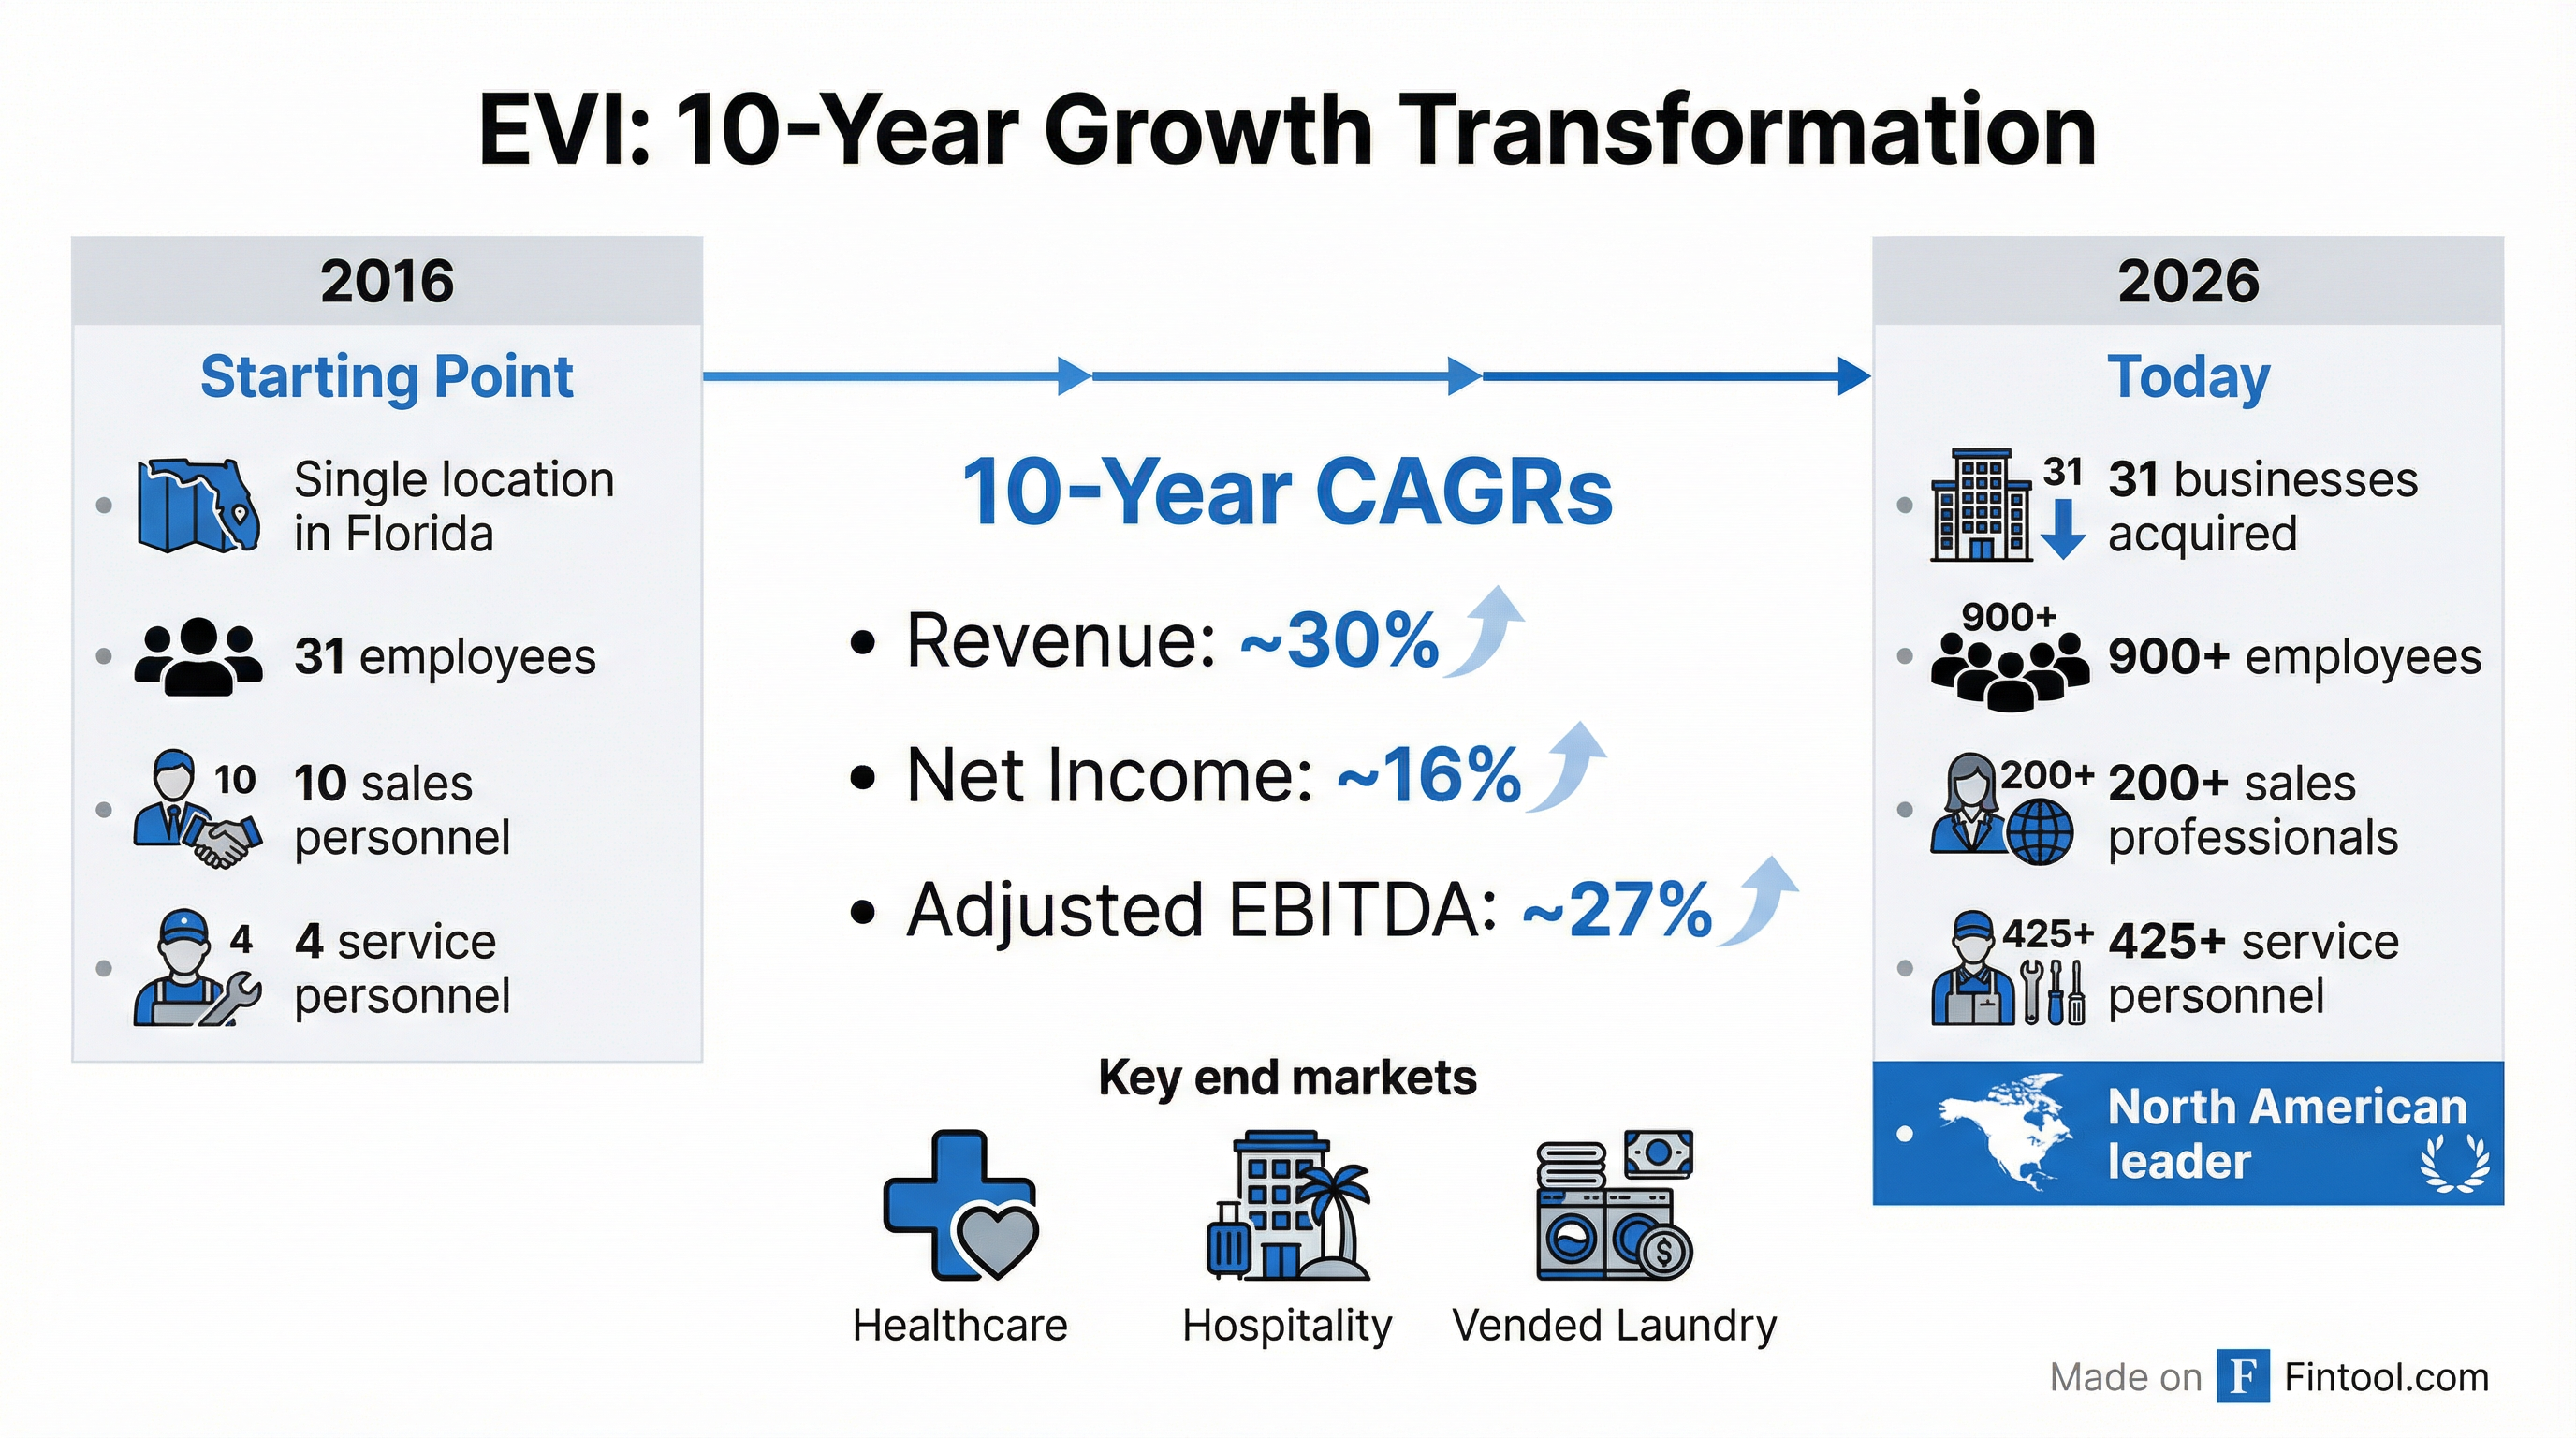
Since commencing its buy-and-build strategy in 2016, EVI has transformed dramatically :
10-Year Compound Annual Growth Rates:
- Revenue: ~30% CAGR
- Net Income: ~16% CAGR
- Adjusted EBITDA: ~27% CAGR
What to Watch Going Forward
Near-term catalysts:
- Integration progress on Continental acquisition
- Margin expansion from technology investments
- Working capital normalization as backlog converts to revenue
- Potential new acquisitions from "robust pipeline"
Key risks flagged:
- Tariff exposure on equipment pricing and demand
- Integration risks from acquisitions
- Interest rate sensitivity on debt
- Inflation impact on costs and pricing
Key Takeaways
- Record quarter across metrics — Revenue +24%, operating income +78%, net income +110% year-over-year
- Continental acquisition paying off — Driving gross margin to record 30.8% through product mix and pricing discipline
- Technology investments showing results — 13% improvement in service response time, margin benefits emerging
- Strong backlog — $12M inventory buildup supporting confirmed customer orders
- Continued M&A appetite — "Robust pipeline" of acquisition opportunities being evaluated
Next earnings: Q3 FY2026 expected May 2026
Related Links: